This particular Hagerstown weather station has been in the same general location for over 100 years. Official weather observations for Washington County began at the Chewsville-Bridgeport location and have been made continuously ever since by one observer or another. The Oswald Family began the observations in March of 1898 at the Mr. Daniel farm about 3/4 mile southeast of Chewsville at an elevation of 630 feet above sea level. One son E. Ingram Oswald operated the station at first, and in August 1902 D. Paul Oswald, another son took over the station and continued the observations. In 1948 he moved to the Jefferson Blvd. location just east of town at an elevation of 560 feet. He took his daily readings from that location until his death in 1970.
Mr. D. Paul Oswald was well known in the Hagerstown area for the excellent quality of his weather observations and has contributed much to the study of weather and climate of this area. In 1960 he received from the U.S. Weather Bureau the Thomas Jefferson award, the highest award given to it's cooperative weather observers. In 1963, he received a presidential citation honoring his 60 years as a volunteer weather observer.
When Mr. Oswald became too ill to continue his observations and after his death a few of his neighbors took over the weather observations for about 2 years. One was Lawson Wolfinger and then after his unexpected death the lady across the street Mrs. Hebb took over for a short time. Eventually there wasn't a weather observer for that location. After such a long and excellent record I just hated to see that weather station come to an end. In the mean time I was busy with my weather station also keeping detailed records of the Hagerstown weather and by this time I was using certified National Weather Service instruments. After writing a few letters and made some phone calls the weather records were passed down to me and I have been continuing to take daily detailed weather observations (unbroken) since 1970. My current location just east of town on Jefferson Blvd. is not far from the original location.
It's hard to believe that when I was a child I would hide in the closet every time a thunderstorm blew up or the wind would get up strong. I don't know why but I always knew before anyone that the wind was about to get up high. I guess that's what triggered my interest in weather. Now I stand out in the wind and the storms.
My first weather station was a weather vane made of tinker toys nailed outside my bedroom window. My interest in weather became very strong when I had a weather course in junior high school, my project was to build an anemometer and wind vane. I then started to buy cheap thermometers from the drug store and I got a barometer from the S&H green stamp store. My rain gauge was a tiny plastic tube calibrated in tenths of an inch. Later on I began to build and buy more sophisticated instruments. I remember looking at the weatherwise magazines that the former weather observer here had given me, and seeing some of the really nice looking and expensive instruments advertised in them from Science Associates Inc. and Belfort Instrument Company . I just had to have them and I new someday I would.
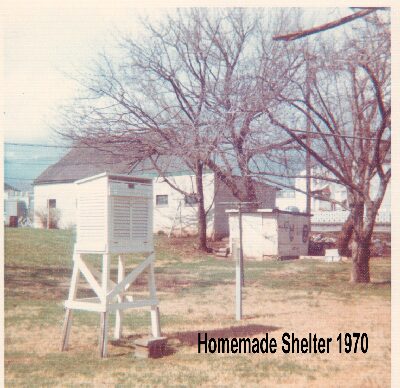
Over time I made several electronic weather instruments and weather instrument shelters each one getting a little better and more professional looking. Finally around 1970 I built a instrument shelter from scratch right down to the exact official measurements of the National Weather Service. Man did that thing look good in my backyard. I bought the official set of certified max-min thermometers on the townsend support. I also had made a rain gauge to meet National Weather Service Specifications and I made some other weather instruments as well. A few years later I started to buy the real thing such as wind speed and direction indicators, rain gauges, etc. but the prices were not as low as I had seen in the earlier catalogs.
Currently there are two types of sensors at my station. The official sensors used to collect the data are mechanical sensors, meaning they have to be read manually to collect information. The other type are electronic or digital sensors which runs by wires to digital weather stations and computers. All of the final weather readings are taken from the manual official instruments because they are the most accurate and never need re-calibration. I must admit the weather readings from my digital weather stations are extremely accurate, reliable, and match my official instruments almost perfectly, but occasionally there may be a very slight difference in the readings, but any disagreements though rare, are corrected in the database to match the official readings.
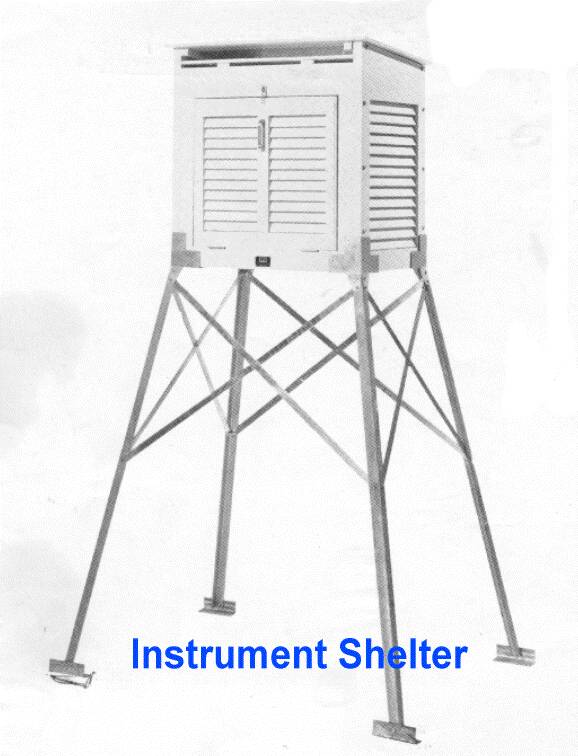
The Instrument Shelter is used to house the thermometers and humidity sensors. It's called the cotton region type shelter. The louvered shelter permits air to circulate freely around the thermometers so that ambient air temperature can be measured. It must be made of wood and painted white so that sunlight is reflected and heat is not absorbed to give false readings. It should also be over a grassy area and not too close to buildings or large blacktop areas. The center of the shelter should be about 5 feet above the ground.
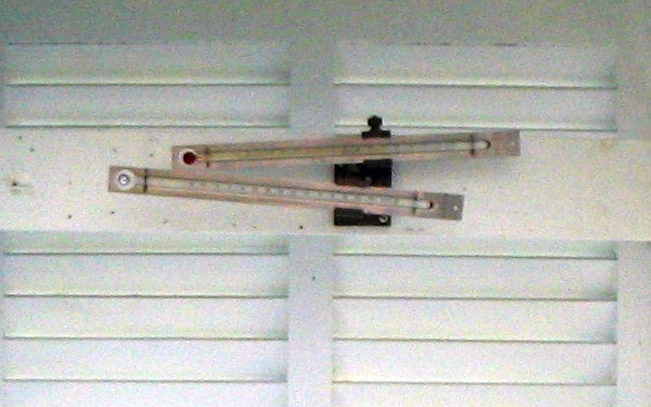
Inside the shelter are the Maximum-Minimum Thermometers. The maximum thermometer has a mercury-filled bulb which expands as the air temperature rises and then stays at the maximum point until it is reset. The minimum thermometer has an index made of glass within the alcohol that retreats with falling temperatures and stays at the lowest point until it is reset. Both thermometers are positioned nearly horizontal on a bracket. To reset the minimum thermometer, the bracket clamp that holds the thermometer is released and the top end is tipped downward so the glass index can slide toward the current temperature. The maximum thermometer works exactly like the old fashioned fever thermometer, to reset it you had to shake the mercury down but here spinning the maximum thermometer on the bracket until the mercury is adjusted downward to the current temperature resets the maximum thermometer.
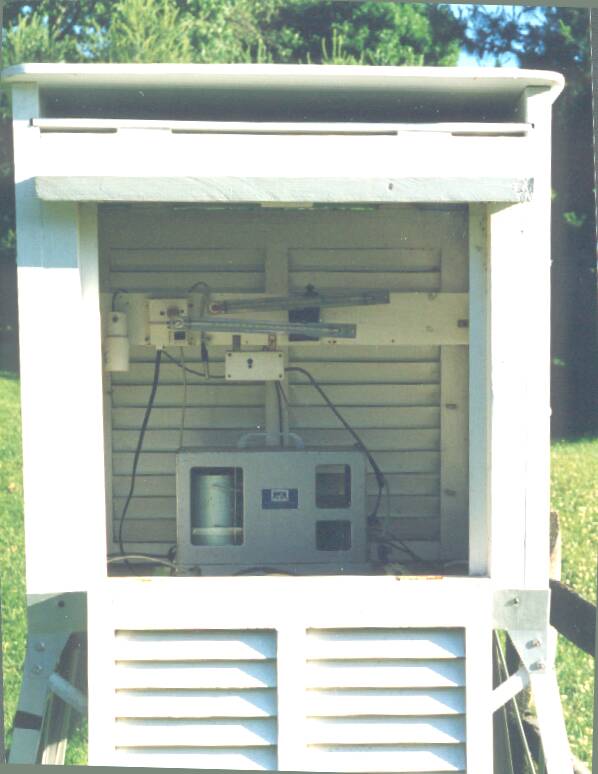
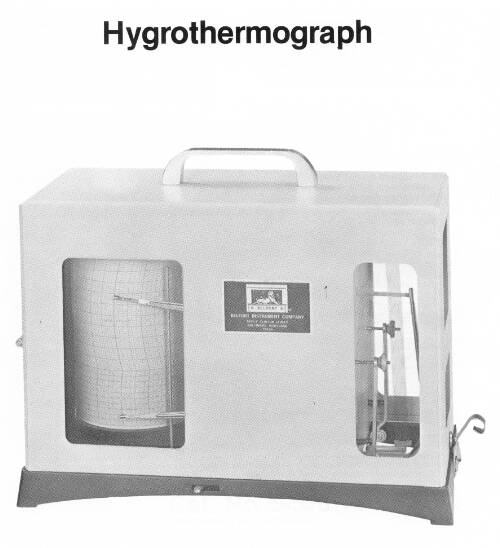
Also inside the instrument shelter is a device called a Hygrothermograph. It comes from two Greek words hygros meaning wet and therme meaning heat. It measures relative humidity and air temperature. This is a spring-wound or battery powered eight day clock instrument that records on a chart the relative humidity and air temperature. The temperature sensor is an alcohol filled metal tube. It is fairly accurate but slower to respond to fast temperature changes but it gives a good idea of the temperature history on a chart for a week. The humidity sensor measures relative humidity by stretching a human hair bundle between mechanical linkages and through expansion and contraction moves a pen on a calibrated chart recording relative humidity in percent. Expansion occurs when the hair bundle absorbs water vapor. This makes the hair bundle heavier and moves the pen up the chart. When the hair bundle loses water vapor it contracts. This makes the hair bundle lighter and moves the pen lower on the chart. Human hair is a very accurate way to measure humidity and has been used for many years. Blond hair works best.
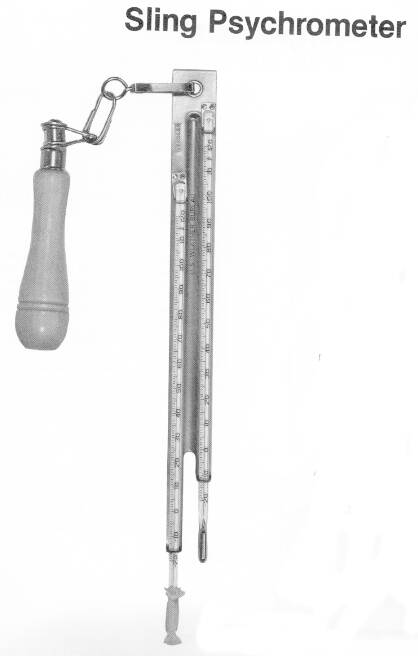
An even more accurate way to measure humidity is the Sling Psychrometer. A sling psychrometer measures the relative humidity of surrounding air. It does this by comparing the temperatures of a dry bulb thermometer and a wet bulb thermometer. The sling psychrometer contains two mercury filled thermometers. One has a damp wick around the bulb at the bottom. The psychrometer is spun around rapidly for a few minutes and readings are taken for the dry and wet bulb temperatures. Because of the water evaporating from the wet wick the wet bulb temperature is cooler or lower and then after it reaches its lowest point you can compare the difference of the two readings, then by looking at a chart it will show the relative humidity. The drier the air the lower the wet bulb temperature will be. When the humidity is 100% both thermometers will read the same. The dew point can also be obtained this way.
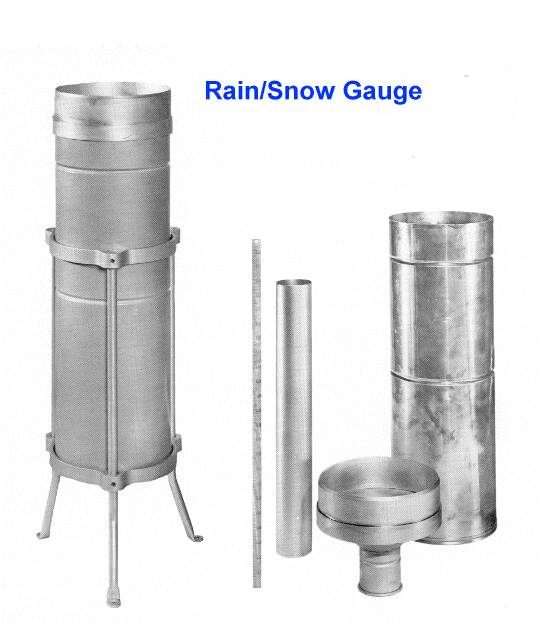
Not far away from the instrument shelter is the Rain Gauge. The rain gauge is used to collect all types of precipitation. It has an eight-inch opening and is read manually. The gauge that consists of an overflow can, measuring tube, rainfall funnel, and measuring stick. All of this is mounted on a support. Precipitation is measured with the graduated measuring stick, meaning the stick is scaled so that it shows the correct amount (in hundredths of an inch) The inner measuring tube holds 2 inches of rain and when that is full it will overflow into the larger can and that will hold another 20 inches of rain or so. During the winter months the funnel and inner measuring tube are removed so that the snow can collect in the larger can. This snowfall is melted down and measured in the smaller measuring tube to get the water content of the snow. Snowfall is also measured in the solid state on the ground. Large snowfalls are measured in the grass and at different spots so you get a good average. Smaller snows are measured on a snow board which is a white wooden board about 2 feet square placed on the ground. The snow is measured on this to the nearest tenth of an inch. Trying to measure smaller snowfalls in the grass in not accurate because the grass holds up the snow and that would give you a higher reading.
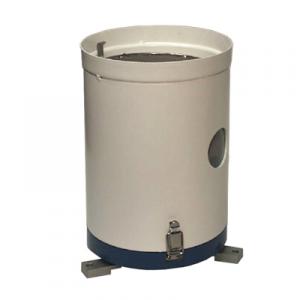
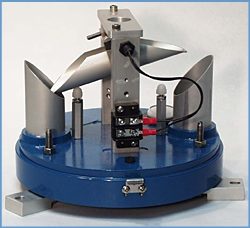
Another type of rain gauge that I use is the Tipping Bucket Rain Gauge. Pic2 This type of gauge is very useful to determine when it rains and the intensity of the rain. Two measuring scoops are used and tip back and forth under the funnel. Each one holds one hundredth of an inch and is counted with electronic switches. When one fills up it will tip and empty the rain then the other scoop moves up under the funnel. My gauge is heated for freezing winter weather this is turned on to keep it from freezing and to melt the snow and ice so that I get the water content of the precipitation.
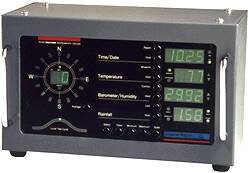
The digital weather stations and computers are used to record weather conditions continuously minute by minute. They are also used to create graphs, store data, and upload information to my weather web site. They have been a tremendous help in recording information when I am not home and analyzing fast changing weather conditions.
The data collected from this station is reported to the National Weather Service the Maryland State Climatologist and the local news media. This data is also used by a variety of people who are interested in agriculture and weather. Now with the computer age and the internet my weather station readings and climate information are accessable to the world.
MAIN / HOME PAGE http://i4weather.net